The 3 AM glow of the laptop screen was a familiar, unwelcome companion. For Alex, now six months into the Platform Lead role at NovaCraft, it was a stark reminder that scaling a platform was an entirely different beast from just using it. The frantic pager alerts of the past, a chaotic symphony of cascading failures, had subsided thanks to the robust Kubernetes foundation laid in the early days. But a new, more insidious kind of problem had emerged.
This time, the alert wasn’t a catastrophic “everything is on fire.” It was a subtle, creeping dread. A single customer, one of their largest, had reported a bizarre, intermittent lag in the checkout API. The issue would appear for a few minutes, then vanish without a trace, leaving no errors in the logs. The backend team was stumped. The API gateway logs showed healthy 200 OK responses. The application logs were clean. To the existing system, everything looked fine. Yet, a key customer was unhappy, and the business was feeling the tremors.
Alex leaned back, the blue light of the terminal reflecting in tired eyes. The promotion to Platform Lead had felt like a victory, a recognition of the mastery gained over Kubernetes. But the challenges had morphed. It was no longer about deploying a container; it was about understanding the intricate dance of a hundred microservices, serving ten different engineering teams, all running on a single, shared platform. The question had evolved from “How do I deploy?” to “How do I run this at scale, securely, observably, and cost-effectively?”
This checkout lag was a ghost in the machine, a problem that couldn’t be seen with their current tools. They were flying blind. The logs told them what had already happened, but they gave no insight into the why. They needed more than just records of past events; they needed vision. They needed to see the system’s heartbeat, its respiration, the subtle fluctuations that signaled trouble long before it became a 3 AM fire drill. Alex knew it was time to stop reacting and start anticipating. It was time to give their platform eyes.
The Observability Trinity: A Framework for Seeing
To solve problems like the phantom checkout lag, we need to move beyond simple monitoring—checking if a system is “up” or “down”—and embrace observability. Observability isn’t just about collecting data; it’s about being able to ask arbitrary questions about your system without having to know in advance what you’ll need to ask. It’s the difference between having a security camera that only records when a specific alarm is triggered versus one that records everything, allowing you to investigate any event, expected or not.
The foundation of modern observability rests on three pillars, often called the observability trinity: metrics, logs, and traces.
Pillar
Description
Analogy
Use Case
Metrics
A time-series of numeric data points, typically collected at regular intervals. They are aggregated, efficient, and ideal for understanding system behavior over time.
The dashboard of your car: speedometer (request rate), engine temperature (CPU usage), fuel gauge (disk space).
Alerting on high CPU usage, tracking API latency trends, capacity planning.
Logs
Immutable, timestamped records of discrete events. They provide detailed, context-rich information about what happened at a specific point in time.
The black box flight recorder of an airplane. It tells the detailed story of a specific event, like a crash.
Debugging a specific error, auditing user actions, understanding the flow of a single request.
Traces
A representation of the end-to-end journey of a single request as it travels through a distributed system. It connects the dots between different services.
A package tracking system. You can see every stop your package made on its way to your door, and how long it spent at each location.
Pinpointing bottlenecks in a microservices architecture, understanding service dependencies.
For Alex’s phantom lag problem, logs were insufficient because no explicit error event was being generated. Traces would be fantastic for seeing the entire request journey, but implementing distributed tracing is a significant undertaking. Metrics, however, are the perfect starting point. By collecting detailed performance metrics from every component—request latency, queue depths, database connection pool usage—Alex can start to build a picture of the system’s health and spot the subtle correlations that lead to the intermittent lag. This is where Prometheus shines.
Prometheus: The Time-Series Titan
Prometheus is an open-source monitoring and alerting toolkit originally built at SoundCloud. It has since become the de facto standard for metrics-based monitoring in the cloud-native world, and for good reason. Its core strength lies in its dimensional data model and its powerful query language, PromQL.
Think of Prometheus not as a simple data store, but as a time-traveling detective for your systems. It periodically takes snapshots (or scrapes) of numerical metrics from your applications and stores them in a highly efficient time-series database. Each time-series is uniquely identified by its name and a set of key-value pairs called labels. This dimensional model is incredibly powerful. Instead of a metric like http_requests_total, you have http_requests_total{method="POST", handler="/api/v1/checkout", status="200"}. This allows you to slice and dice your data with surgical precision using PromQL, answering questions like:
“Show me the 95th percentile latency for all POST requests to the checkout API over the last 6 hours.”
“Alert me if the rate of 500 errors on any handler exceeds 1% for more than 5 minutes.”
“What is the per-instance memory usage for all pods in the nova-api namespace?”
The Pull Model: A Shift in Perspective
One of the most fundamental design decisions in Prometheus is its pull-based collection model. Instead of applications pushing their metrics to a central server, Prometheus actively reaches out to them over HTTP and scrapes the current values from a designated /metrics endpoint. This might seem like a small detail, but it has profound implications:
Centralized Control: You configure scrape targets centrally in Prometheus. You don’t need to configure every single application with the address of the monitoring server. This makes service discovery and management vastly simpler, especially in a dynamic environment like Kubernetes where pods come and go.
Built-in Health Monitoring: If Prometheus can’t scrape a target, that target is automatically considered unhealthy. You get service health monitoring for free.
Simplified Application Logic: Your application doesn’t need to know anything about the monitoring system. It simply exposes its current state on an HTTP endpoint. There’s no need for complex client-side buffering, retry logic, or discovery mechanisms.
The Prometheus Architecture
Prometheus is not a single binary but a suite of components that work together to provide a full monitoring solution.
(Note: This is a conceptual diagram. In a real deployment, these components might be deployed as separate pods in Kubernetes.)
Prometheus Server: This is the heart of the system. It handles service discovery, scraping, storage, and querying (PromQL). It’s the component we’ve been discussing so far.
Exporters: What about services that don’t natively expose Prometheus-compatible metrics? This is where exporters come in. An exporter is a piece of software that acts as a sidecar or standalone process, translating metrics from a third-party system (like a database, a message queue, or even the Linux kernel) into the Prometheus format. There are hundreds of official and community-built exporters for almost any system you can imagine.
Alertmanager: Prometheus itself doesn’t send alerts. Its job is to apply alerting rules to the metrics it collects and, if a condition is met, fire an alert to the Alertmanager. The Alertmanager then takes over, handling deduplication, grouping, silencing, and routing of alerts to the correct notification channel, such as Slack, PagerDuty, or email.
Pushgateway: While the pull model is preferred, there are some use cases where it’s not practical, such as for very short-lived jobs (like a batch job that runs for a few seconds and then terminates). For these cases, the Pushgateway allows ephemeral jobs to push their metrics to it. The Pushgateway then holds onto these metrics so Prometheus can scrape them on its next interval. It should be used with caution, as it can easily become a single point of failure and a metrics bottleneck.
With this architecture in mind, Alex can see a clear path forward. The plan is to deploy Prometheus to start collecting metrics from all the Kubernetes components and, crucially, from the applications themselves. But looking at raw metrics in a database isn’t enough. To truly understand the story the data is telling, they need a way to visualize it. They need a dashboard.
Grafana: The Art of Visualization
If Prometheus is the detective, Grafana is the storyteller. It is an open-source platform for monitoring and observability that excels at turning the time-series data from Prometheus (and many other data sources) into beautiful, insightful dashboards. While PromQL is powerful for querying data, Grafana is what makes that data accessible and understandable to a wider audience, from platform engineers like Alex to application developers and even business stakeholders.
Grafana allows you to:
Build Dashboards: Create dynamic and reusable dashboards with a wide variety of panel types, including graphs, tables, heatmaps, and single-stat readouts.
Connect to Multiple Data Sources: While we’re focusing on Prometheus, Grafana supports dozens of other data sources, allowing you to bring data from different systems together in one place.
Alerting: Grafana also has its own alerting engine, which can be used to create alerts based on visual data from your dashboards.
Transform and Customize: You can apply transformations to your data, customize the look and feel of your panels, and use variables to create interactive dashboards.
For Alex and the NovaCraft team, Grafana is the canvas where they will paint the picture of their platform’s health. It will allow them to build a dedicated dashboard for the checkout service, visualizing key metrics like request latency, error rates, and resource utilization side-by-side. This will empower the backend team to see the impact of their code changes in real-time and, hopefully, finally catch the ghost that’s been haunting their API.
The Prometheus Operator: Kubernetes-Native Monitoring
Deploying and managing this entire stack—Prometheus, Alertmanager, and all the necessary configurations—in Kubernetes can be complex. This is where the Prometheus Operator comes in. The Prometheus Operator is a piece of software that runs in your cluster and automates the management of your monitoring infrastructure using Kubernetes-native resources.
Instead of manually configuring Prometheus scrape targets, you create a ServiceMonitor or PodMonitor Custom Resource (CRD). These CRDs tell the operator how to discover and scrape metrics from your services and pods. The operator then automatically generates the required Prometheus configuration and keeps it in sync. This is a game-changer for managing monitoring at scale in a dynamic Kubernetes environment.
Fortunately, we don’t have to assemble all these pieces ourselves. The community has provided a comprehensive Helm chart that packages the Prometheus Operator and the entire monitoring stack for easy deployment. It’s time to get our hands dirty.
Hands-On: Deploying the Kube-Prometheus-Stack
Now it’s time to put theory into practice. We will deploy the kube-prometheus-stack to our Minikube cluster, instrument a sample application with custom metrics, and build a Grafana dashboard to visualize them.
Prerequisites
Minikube: A running Minikube cluster. If you don’t have one, you can start it with minikube start --cpus=4 --memory=8192.
Helm: The Kubernetes package manager. Make sure you have Helm 3 installed.
kubectl: The Kubernetes command-line tool.
Step 1: Add the Prometheus Community Helm Repository
First, we need to add the Helm repository that contains the kube-prometheus-stack chart.
Now, we can install the chart. We’ll use a minimal configuration for our local setup. Create a file named values.yaml with the following content:
alertmanager:  enabled: false
grafana:  enabled: true  adminPassword: "prom-operator"  ingress:    enabled: true    ingressClassName: nginx    hosts:      - grafana.minikube.local
prometheus:  enabled: true  ingress:    enabled: true    ingressClassName: nginx    hosts:      - prometheus.minikube.local  prometheusSpec:    retention: 1d    podMonitorSelectorNilUsesHelmValues: false    serviceMonitorSelectorNilUsesHelmValues: false
Note: For this to work with minikube, you need to enable the ingress addon: minikube addons enable ingress. You will also need to add the following entries to your /etc/hosts file:
$(minikube ip) grafana.minikube.local
$(minikube ip) prometheus.minikube.local
Now, install the chart into a monitoring namespace:
This will deploy a complete monitoring stack, including Prometheus, Grafana, and the Prometheus Operator. It might take a few minutes for all the pods to be up and running. You can check the status with:
Terminal window
kubectlgetpods-nmonitoring
Once all pods are in the Running state, you can access Grafana at http://grafana.minikube.local and Prometheus at http://prometheus.minikube.local.
Step 3: Instrumenting a Sample Application
To see the power of Prometheus, we need an application that exposes custom metrics. We’ll use a simple Go application that exposes a custom metric novacraft_api_checkout_latency_seconds.
Now, build and push the Docker image. You can use the Docker daemon within Minikube to avoid pushing to a remote registry:
Terminal window
eval $(minikubedocker-env)
dockerbuild-tnovacraft-api:v1.
Step 4: Deploy the Application and ServiceMonitor
Now, let’s deploy our application to Kubernetes. Create a file named deployment.yaml:
apiVersion: apps/v1
kind: Deployment
metadata:
name: novacraft-api
labels:
app: novacraft-api
spec:
replicas: 1
selector:
matchLabels:
app: novacraft-api
template:
metadata:
labels:
app: novacraft-api
spec:
containers:
- name: novacraft-api
image: novacraft-api:v1
imagePullPolicy: IfNotPresent
ports:
- containerPort: 8080
---
apiVersion: v1
kind: Service
metadata:
name: novacraft-api
labels:
app: novacraft-api
spec:
selector:
app: novacraft-api
ports:
- name: http
port: 8080
targetPort: 8080
And a ServiceMonitor to tell Prometheus how to scrape our application. Create a file named servicemonitor.yaml:
apiVersion: monitoring.coreos.com/v1
kind: ServiceMonitor
metadata:
name: novacraft-api-monitor
labels:
release: prometheus-stack
spec:
selector:
matchLabels:
app: novacraft-api
endpoints:
- port: http
path: /metrics
interval: 15s
Now, apply these manifests:
Terminal window
kubectlapply-fdeployment.yaml
kubectlapply-fservicemonitor.yaml-nmonitoring
Step 5: Build a Grafana Dashboard
Now for the fun part! Let’s build a Grafana dashboard to visualize our custom metric.
Access Grafana: Open your browser and go to http://grafana.minikube.local. Log in with the username admin and the password prom-operator.
Create a new dashboard: Click the ”+” icon on the left sidebar and select “Create Dashboard”.
Add a new panel: Click “Add new panel”.
Configure the panel:
In the “Query” tab, make sure your data source is set to “Prometheus”.
In the “Metrics” field, enter the following PromQL query: rate(novacraft_api_checkout_latency_seconds_sum[5m]) / rate(novacraft_api_checkout_latency_seconds_count[5m])
This query calculates the average checkout latency over a 5-minute window.
In the “Legend” field, you can use {{customer_id}} to display the customer ID from the metric label.
Go to the “Panel” tab on the right to customize the title, description, and visualization type.
Save the dashboard: Click the save icon at the top right, give your dashboard a name, and click “Save”.
Now you have a live dashboard showing the latency of your checkout API! You can generate some traffic to the API and see the graph update in real-time.
Step 6: Set Up an Alert
Finally, let’s set up an alert to notify us if the checkout latency gets too high.
Edit your panel: Go back to your dashboard, click the title of the panel you just created, and select “Edit”.
Go to the “Alert” tab: Click the “Alert” tab.
Create an alert:
Click “Create Alert”.
Configure the rule: We’ll set a simple threshold. For example, alert if the average latency is greater than 0.4 seconds for 1 minute.
Configure notifications: You can set up different notification channels, like Slack or PagerDuty. For now, we’ll just see the alert in Grafana.
Save the dashboard: Save the dashboard again.
Now, if the checkout latency exceeds the threshold, the panel will change color, and you’ll see an alert in the Grafana UI. In a real-world scenario, this alert would be routed to Alex’s PagerDuty, triggering a notification.
Debugging and Troubleshooting
Even with a powerful stack like Prometheus and Grafana, things can go wrong. Here are some common issues you might encounter:
Prometheus can’t scrape my application:
Check the ServiceMonitor: Ensure the labels in the ServiceMonitor’s selector match the labels on your Service.
Check the namespace: The ServiceMonitor must be in the same namespace as the Prometheus Operator, or you need to configure the operator to look in other namespaces.
Check the /metrics endpoint: Use kubectl port-forward to access your application’s pod and manually curl the /metrics endpoint to ensure it’s serving valid Prometheus metrics.
My Grafana dashboard is empty:
Check the data source: Make sure your Grafana data source is configured correctly and can connect to the Prometheus service.
Check your PromQL query: Use the Prometheus UI at http://prometheus.minikube.local to test your PromQL query and ensure it’s returning data.
Check the time range: Make sure the time range in your Grafana dashboard is set to a period when your application was running and generating metrics.
Alerts are not firing:
Check the alert rule: Verify the conditions in your alert rule are being met.
Check the Alertmanager configuration: If you’re using Alertmanager, ensure it’s configured correctly to route alerts to your desired notification channel.
Key Takeaways
This chapter covered a lot of ground, from the conceptual foundations of observability to the practical implementation of a modern monitoring stack. Here are the key points to remember:
Concept
Description
Observability Trinity
The three pillars of observability are metrics, logs, and traces. Each provides a different perspective on your system’s behavior.
Prometheus
A powerful, open-source monitoring system that uses a pull-based model to collect time-series metrics. Its dimensional data model and PromQL query language allow for flexible and powerful queries.
Grafana
A visualization platform that turns time-series data from Prometheus and other sources into insightful dashboards.
Prometheus Operator
A Kubernetes operator that automates the deployment and management of Prometheus and its components using custom resources like ServiceMonitor and PodMonitor.
Custom Metrics
Instrumenting your own applications with custom metrics is crucial for gaining deep insights into their behavior and performance.
A New Dawn for NovaCraft
Weeks later, the 3 AM alerts were a distant memory. The phantom checkout lag hadn’t just been identified; it had been eradicated. The Grafana dashboard Alex built became the central nervous system for the entire backend team. They could now see, with crystal clarity, the impact of every deploy, every feature flag, every subtle change in user traffic. The mystery was gone, replaced by data-driven confidence.
Alex looked at the dashboard, a complex but beautiful tapestry of lines and colors representing the health of the NovaCraft platform. They hadn’t just solved a technical problem; they had changed the culture. The conversation had shifted from reactive firefighting to proactive performance tuning and capacity planning. The platform was no longer a black box.
But as one challenge was conquered, a new one loomed on the horizon. The platform was stable, it was observable, but was it secure? With ten teams deploying code multiple times a day, the attack surface was growing. How could they ensure that every container, every configuration, every piece of code entering the cluster was secure by default? The next stage of the odyssey was clear: they needed to build a fortress. The next chapter would be about locking down the cluster, implementing security policies, and defending against the ever-present threats of the digital world.
This is Part 3 of Season 2 of The Container Odyssey.
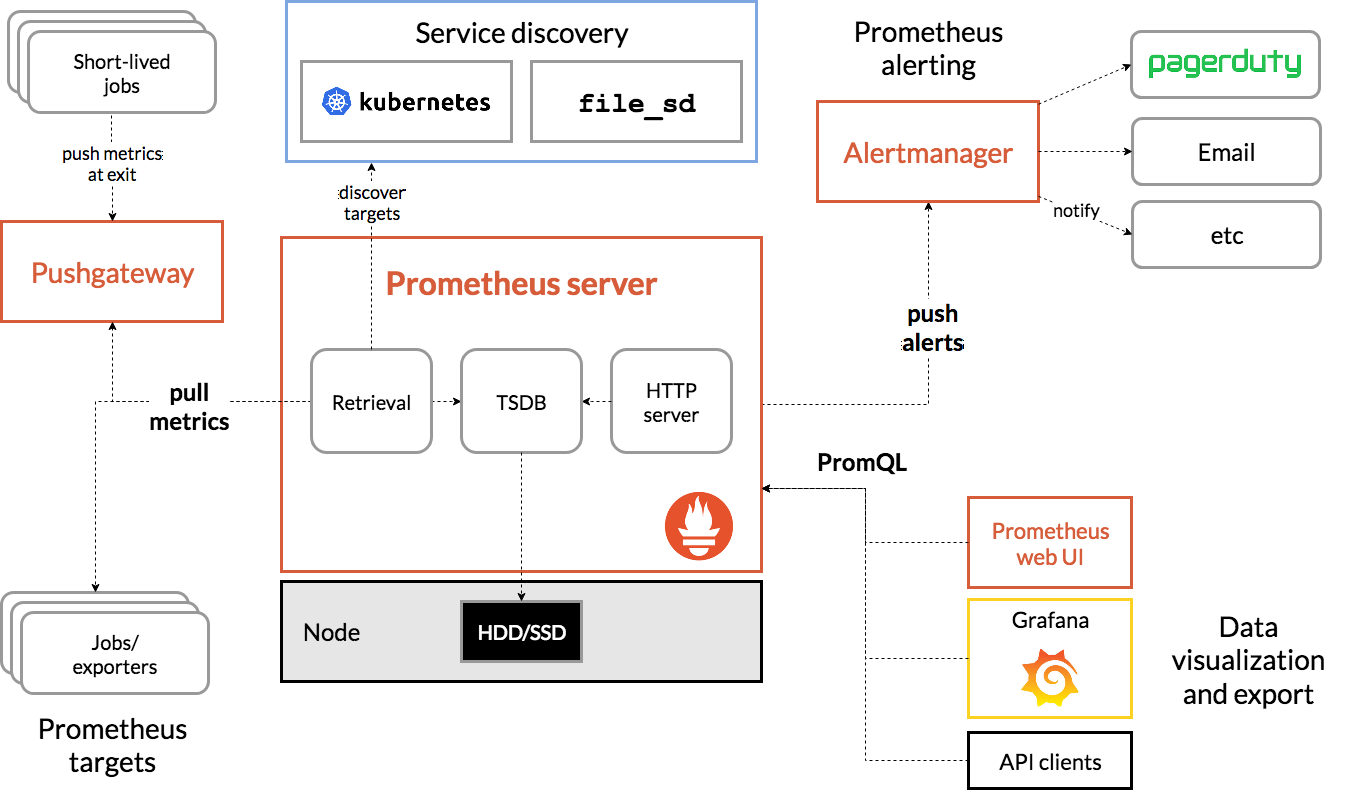 (Note: This is a conceptual diagram. In a real deployment, these components might be deployed as separate pods in Kubernetes.)